DescriptionTable DataChart and Figure Data
Ch.10 VEHICLE
Ch.10 VEHICLE
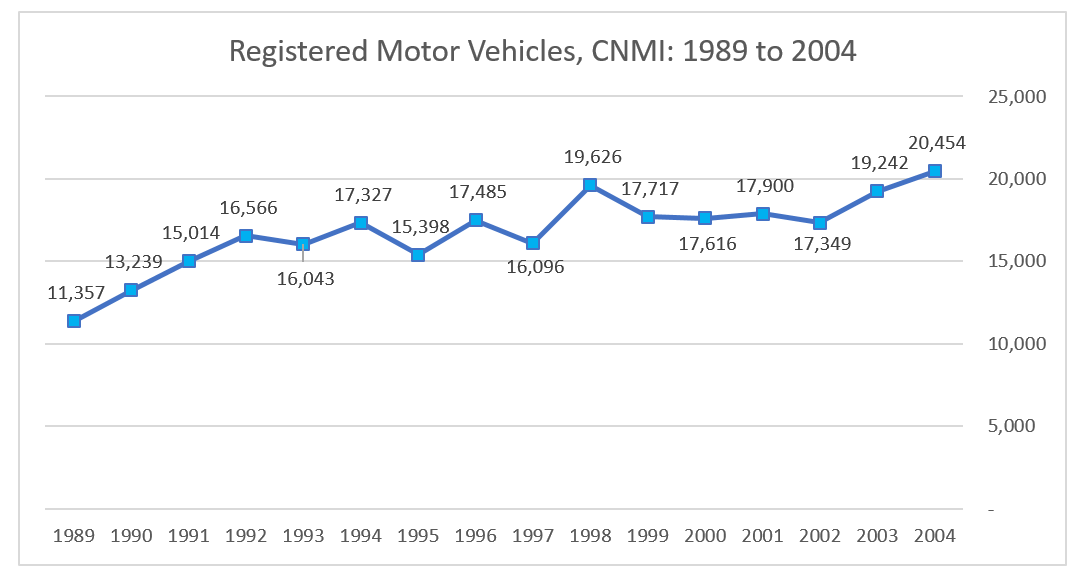
SY 2017 Table 10.3-1 Registered Motor Vehicles by Type, CNMI: 1989 to 2004
Statistical Yearbook 2017 CNMI CSD
Note: “…” means data not available
| New | Island Dealer | Import | Renewal | Transfer | |
|---|---|---|---|---|---|
| Source: Department of Public Safety, Bureau of Motor Vehicles | |||||
| 2004 | 1,567 | … | 396 | 15,849 | 2,448 |
| 2003 | 1,557 | … | 407 | 16,150 | 1,982 |
| 2002 | 830 | … | 279 | 15,579 | 5,123 |
| 2001 | 905 | 913 | 289 | 16,141 | 5,072 |
| 2000 | 839 | 851 | 279 | 16,777 | 4,920 |
| 1999 | 1,090 | 876 | 214 | 16,627 | 5,234 |
| 1998 | 1,806 | 8 | 1,798 | 17,820 | 5,554 |
| 1997 | 2,632 | 1,757 | 875 | 13,464 | 3,678 |
| 1996 | 2,061 | 1,415 | 646 | 15,424 | 3,178 |
| 1995 | 1,879 | 1,314 | 565 | 13,519 | – |
| 1994 | 1,772 | 1,288 | 484 | 15,555 | 3,792 |
| 1993 | 1,662 | 1,290 | 372 | 14,381 | 3,354 |
| 1992 | 2,180 | 1,707 | 473 | 14,386 | 1,744 |
| 1991 | 3,300 | 2,798 | 502 | 11,714 | 1,823 |
| 1990 | 3,572 | 2,918 | 654 | 9,667 | 1,549 |
| 1989 | 2,899 | 2,344 | 555 | 8,458 | 829 |
SY 2017 Table 10.3-2 Registered Vehicles, Saipan 1990 to 2004
Statistical Yearbook 2017 CNMI CSD
| New Registration | Renewal | Heavy Equipment | |
|---|---|---|---|
| Source: Department of Public Safety, Bureau of Motor Vehicles | |||
| 2004 | 1,557 | 14,927 | 1,212 |
| 2003 | 1,286 | 16,150 | 1,006 |
| 2002 | 830 | 15,579 | 940 |
| 2001 | 913 | 16,141 | 748 |
| 2000 | 839 | 16,777 | 1,118 |
| 1999 | 1,090 | 16,627 | 957 |
| 1998 | 1,798 | 17,820 | 1,111 |
| 1997 | 1,736 | 13,266 | 219 |
| 1996 | 2,061 | 15,424 | 1,159 |
| 1995 | 1,348 | 11,489 | 377 |
| 1994 | 1,659 | 14,132 | 376 |
| 1993 | 1,676 | 14,526 | 1,047 |
| 1992 | 2,180 | 14,386 | 806 |
| 1991 | 3,300 | 11,714 | 694 |
| 1990 | 3,572 | 9,657 | 517 |
Ch.10 VEHICLE
To download, right click the chart and select “Save Image As”…