DescriptionTable DataChart and Figure Data
Ch.8 VISITORS
Ch.8 VISITORS
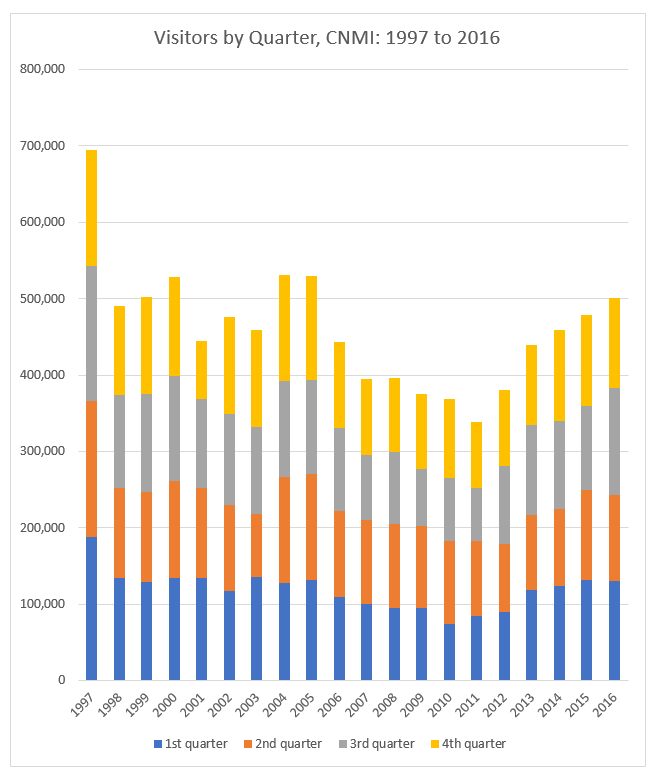
SY 2017 Table 8.2 Visitor Arrivals by Quarter, CNMI: 1997 to 2016
Statistical Yearbook 2017 CNMI CSD
| Year | 1st quarter | 2nd quarter | 3rd quarter | 4th quarter |
|---|---|---|---|---|
| Source: Marianas Visitors Authority | ||||
| 2016 | 130,609 | 112,362 | 139,971 | 118,527 |
| 2015 | 131,148 | 118,770 | 110,127 | 118,547 |
| 2014 | 123,605 | 100,470 | 115,531 | 119,634 |
| 2013 | 118,407 | 98,973 | 117,612 | 103,916 |
| 2012 | 90,167 | 88,337 | 103,105 | 98,933 |
| 2011 | 84,535 | 98,773 | 68,684 | 86,114 |
| 2010 | 73,630 | 109,786 | 81,642 | 103,128 |
| 2009 | 95,482 | 107,434 | 73,764 | 99,128 |
| 2008 | 94,705 | 110,693 | 93,939 | 97,160 |
| 2007 | 100,720 | 109,643 | 85,368 | 99,629 |
| 2006 | 109,038 | 112,496 | 108,738 | 113,540 |
| 2005 | 131,749 | 139,345 | 122,028 | 136,435 |
| 2004 | 127,460 | 139,647 | 124,525 | 139,952 |
| 2003 | 135,360 | 82,801 | 113,836 | 127,460 |
| 2002 | 117,850 | 111,821 | 119,430 | 126,446 |
| 2001 | 134,260 | 117,755 | 116,435 | 75,831 |
| 2000 | 134,243 | 127,234 | 137,888 | 129,232 |
| 1999 | 129,479 | 117,707 | 127,856 | 126,746 |
| 1998 | 134,207 | 118,029 | 121,369 | 116,560 |
| 1997 | 187,921 | 178,036 | 176,238 | 152,602 |
To download HD image, right click on image and select “Save Image As”…


