DescriptionTable DataChart and Figure Data
Ch.15 PERMITS
Ch.15 PERMITS
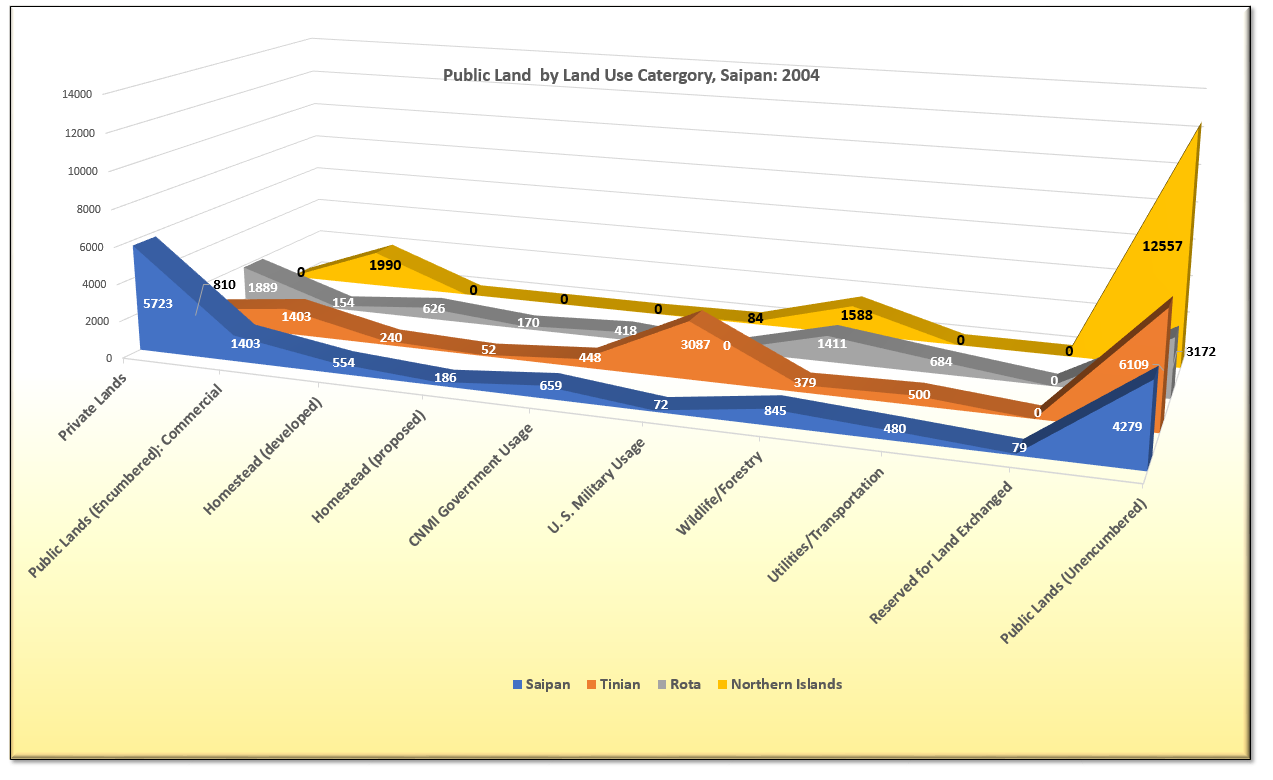
SY 2017 Table 15.2 Public Land by Land Use Catergory, CNMI: 2004
Statistical Yearbook 2017 CNMI CSD
| Land Use Category | Saipan Area (Hectares) |
Saipan % |
Tinian Area (Hectares) |
Tinian % |
Rota Area (Hectares) |
Rota % |
Northern Islands Area (Hectares) |
|---|---|---|---|---|---|---|---|
| Source: Marianas Public Land Authority | |||||||
| Private Lands | 5,723 | 47.0% | 810 | 8.0% | 1,889 | 22.2% | – |
| Public Lands (Encumbered) Commercial |
1,403 | 11.0% | 1,403 | 13.8% | 154 | 1.8% | 1,990 |
| Homestead (developed) | 554 | 5.0% | 240 | 2.4% | 626 | 7.3% | – |
| Homestead (proposed) | 186 | 2.0% | 52 | 0.5% | 170 | 2.0% | – |
| CNMI Government Usage | 659 | 5.0% | 448 | 4.4% | 418 | 4.9% | – |
| U. S. Military Usage | 72 | 1.0% | 3,087 | 30.3% | – | 0.0% | 84 |
| Wildlife/Forestry | 845 | 6.0% | 379 | 4.0% | 1,411 | 16.6% | 1,588 |
| Utilities/Transportation | 480 | 4.0% | 500 | 4.9% | 684 | 8.0% | – |
| Reserved for Land Exchanged | 79 | 1.0% | – | 0.0% | – | 0.0% | – |
| Public Lands (Unencumbered) | 4,279 | 35.0% | 6,109 | 60.0% | 3,172 | 37.2% | 12,557 |
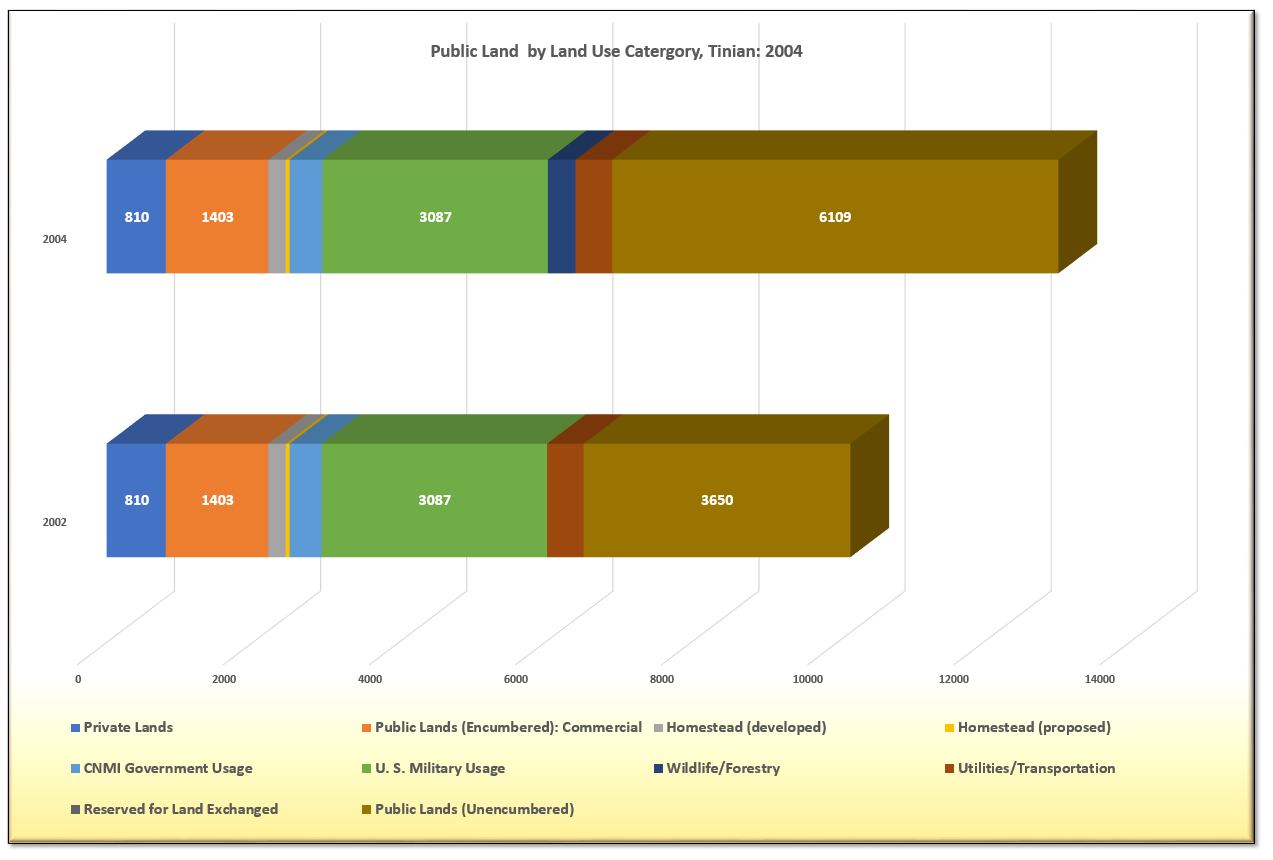
SY 2017 Table 15.2a Public Land by Land Use Catergory, Tinian: 2003
Statistical Yearbook 2017 CNMI CSD
| Land Use Category | 2003 Area (Hectares) |
2003 % |
|---|---|---|
| Source: Marianas Public Land Authority | ||
| Private Lands | 810 | 8.0% |
| Public Lands (Encumbered): Commercial |
1,403 | 13.8% |
| Homestead (developed) | 240 | 2.4% |
| Homestead (proposed) | 52 | 0.5% |
| CNMI Government Usage | 438 | 4.3% |
| U. S. Military Usage | 3,087 | 30.3% |
| Wildlife/Forestry | – | 0.0% |
| Utilities/Transportation | 500 | 4.9% |
| Reserved for Land Exchanged | – | 0.0% |
| Public Lands (Unencumbered) | 3,650 | 35.9% |
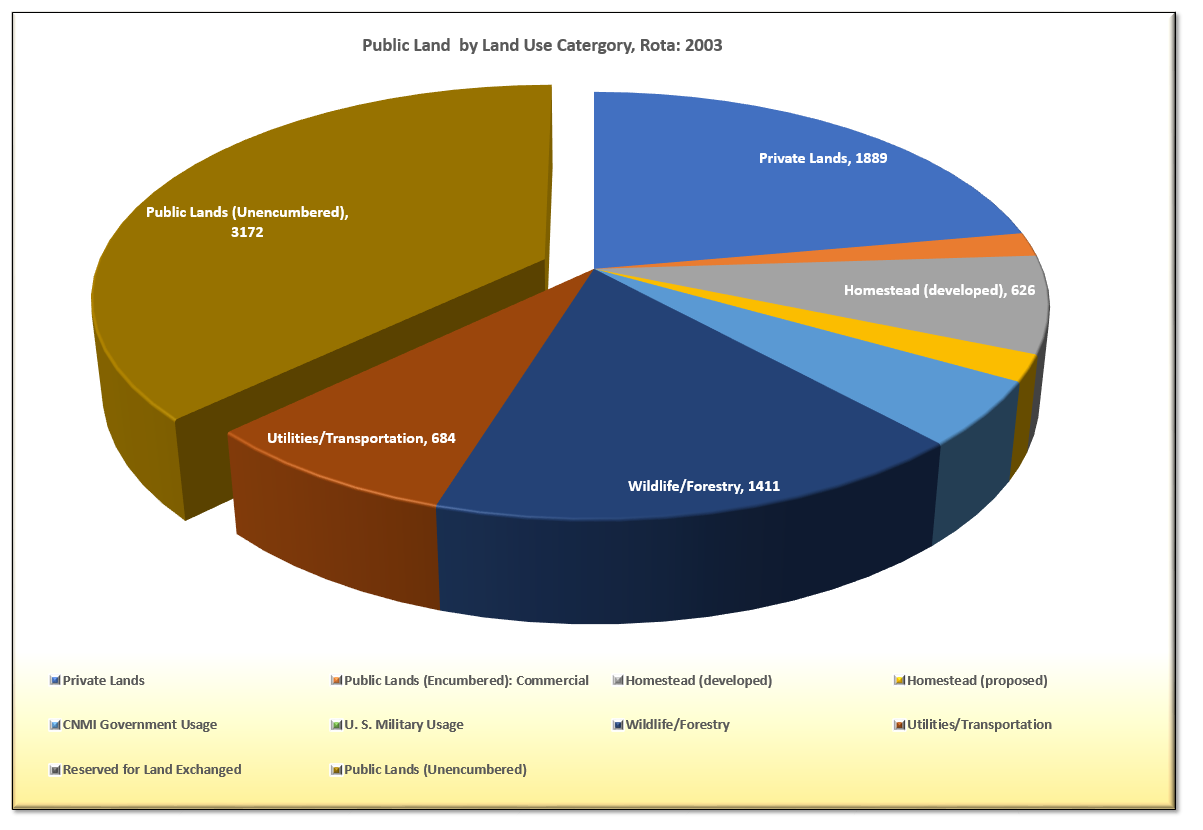
SY 2017 Table 15.2b Public Land by Land Use Catergory, Rota: 2003
Statistical Yearbook 2017 CNMI CSD
| Land Use Category | Area (Hectares) | Percent |
|---|---|---|
| Source: Marianas Public Land Authority | ||
| Private Lands | 1,889 | 22.2% |
| Public Lands (Encumbered): Commercial | 154 | 1.8% |
| Homestead (developed) | 626 | 7.3% |
| Homestead (proposed) | 170 | 2.0% |
| CNMI Government Usage | 418 | 4.9% |
| U. S. Military Usage | – | 0.0% |
| Wildlife/Forestry | 1,411 | 16.6% |
| Utilities/Transportation | 684 | 8.0% |
| Reserved for Land Exchanged | – | 0.0% |
| Public Lands (Unencumbered) | 3,172 | 37.2% |
SY 2017 Table 15.2c Public Land by Land Use Catergory, Northern Islands: 2003
Statistical Yearbook 2017 CNMI CSD
| Land Use Category | Area (Hectares) | Percent |
|---|---|---|
| Source: Marianas Public Land Authority | ||
| Private Lands | – | 0.0% |
| Public Lands (Encumbered): Commercial Quarries | 1,990 | 12.2% |
| Homestead (developed) | – | 0.0% |
| Homestead (proposed) | – | 0.0% |
| CNMI Government Usage | – | 0.0% |
| U. S. Military Usage | 84 | 0.5% |
| Wildlife/Forestry | 1,588 | 9.7% |
| Utilities/Transportation | – | 0.0% |
| Reserved for Land Exchanged | – | 0.0% |
| Public Lands (Unencumbered) | 12,557 | 77.0% |
| Pending Land Claims | 85 | 0.5% |
Ch.15 PERMITS
To download, right click the chart and select “Save Image As”…


