DescriptionTable DataChart and Figure Data
Ch.8 VISITORS
Ch.8 VISITORS
SY 2017 Table 8.1 Visitor Entries by Country of Origin, CNMI: 2010 to 2016
Statistical Yearbook 2017 CNMI CSD
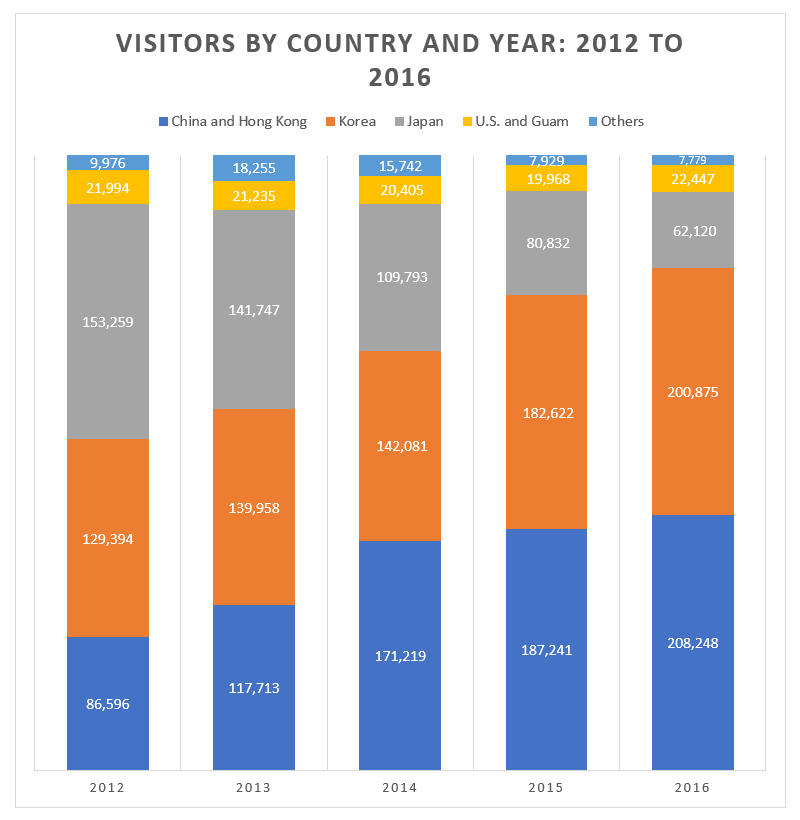
| Visitor Arrivals | 2016 | 2016 | 2015 | 2015 | 2014 | 2014 | 2013 | 2013 | 2012 | 2012 |
|---|---|---|---|---|---|---|---|---|---|---|
| Source: Marianas Visitors Authority (MVA) | ||||||||||
| Japan | 62,120 | 12.4% | 80,832 | 16.9% | 109,793 | 23.9% | 141,747 | 32.3% | 153,259 | 38.2% |
| Korea | 200,875 | 40.1% | 182,622 | 38.2% | 142,081 | 30.9% | 139,958 | 31.9% | 129,394 | 32.3% |
| U.S. and Guam | 22,447 | 4.5% | 19,968 | 4.2% | 20,405 | 4.4% | 21,235 | 4.8% | 21,994 | 5.5% |
| China and Hong Kong | 208,248 | 41.5% | 187,241 | 39.1% | 171,219 | 37.3% | 117,713 | 26.8% | 86,596 | 21.6% |
| Russia | 1,796 | 0.4% | 1,374 | 0.3% | 11,200 | 2.4% | 12,493 | 2.8% | 6,282 | 1.6% |
| Philippines | 999 | 0.2% | 2,405 | 0.5% | 694 | 0.2% | 649 | 0.1% | 528 | 0.1% |
| Others* | 4,984 | 1.0% | 4,150 | 0.9% | 3,848 | 0.8% | 5,113 | 1.2% | 3,166 | 0.8% |
To download HD image, right click on image and select “Save Image As”…