DescriptionTable DataChart and Figure Data
Ch.8 VISITORS
Ch.8 VISITORS
| 2016.4 | 2016.3 | 2016.2 | 2016.1 | 2015.4 | 2015.3 | 2015.2 | 2015.1 | 2014.4 | 2014.3 | 2014.2 | 2014.1 | |
|---|---|---|---|---|---|---|---|---|---|---|---|---|
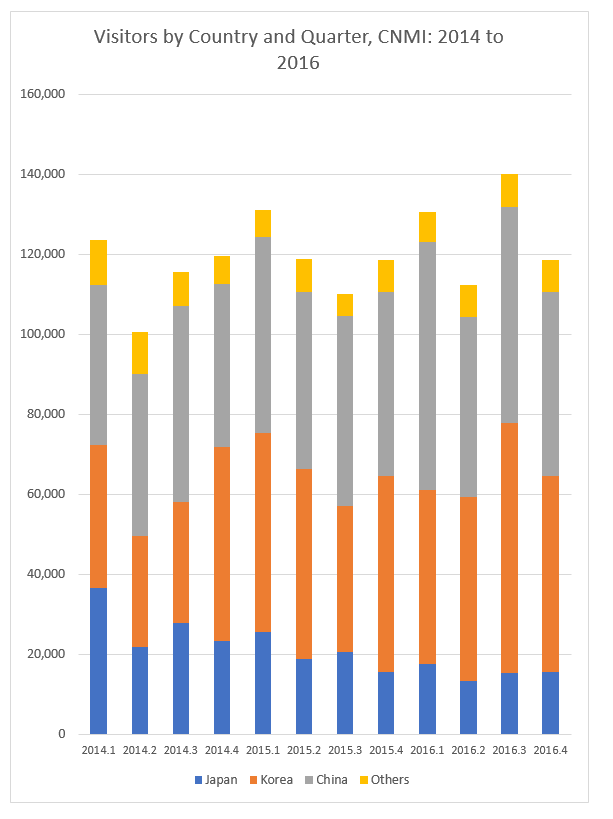
| Japan | 15,726 | 15,320 | 13,394 | 17,680 | 15,726 | 20,674 | 18,829 | 25,603 | 23,476 | 27,883 | 21,766 | 36,668 |
| Korea | 48,939 | 62,460 | 45,970 | 43,506 | 48,939 | 36,432 | 47,581 | 49,670 | 48,269 | 30,319 | 27,879 | 35,614 |
| US and Guam | 5,644 | 5,741 | 5,582 | 5,480 | 5,644 | 4,093 | 5,777 | 4,454 | 4,920 | 4,590 | 5,080 | 5,815 |
| China | 45,767 | 54,024 | 44,951 | 61,796 | 45,767 | 47,466 | 44,192 | 49,084 | 40,723 | 48,945 | 40,319 | 40,134 |
| Russia | 549 | 315 | 354 | 578 | 389 | 270 | 412 | 303 | 904 | 2,409 | 3,995 | 3,892 |
| Hong Kong | 389 | 527 | 364 | 430 | 182 | 147 | 271 | 132 | 241 | 284 | 368 | 205 |
| Philippines | 182 | 306 | 351 | 160 | 549 | 256 | 751 | 849 | 161 | 184 | 178 | 171 |
| Others | 1,331 | 1,278 | 1,396 | 979 | 1,351 | 789 | 957 | 1,053 | 940 | 917 | 885 | 1,106 |
| Source: Marianas Visitors Authority (MVA) |
SY 2017 Table 8.4 Visitor Entries, CNMI: FY 2014 to FY 2016
Statistical Yearbook 2017 CNMI CSD
| 2016.4 | 2016.3 | 2016.2 | 2016.1 | 2015.4 | 2015.3 | 2015.2 | 2015.1 | 2014.4 | 2014.3 | 2014.2 | 2014.1 | |
|---|---|---|---|---|---|---|---|---|---|---|---|---|
| Source: Marianas Visitors Authority (MVA) | ||||||||||||
| Visitor Arrivals | 118527 | 139971 | 112362 | 130609 | 118547 | 110127 | 118770 | 131148 | 119634 | 115531 | 100470 | 123605 |
| % Change from Previous Year: | 0.0% | 27.1% | -5.4% | -0.4% | -0.9% | -4.7% | 18.2% | 6.1% | 15.1% | -1.8% | 1.5% | 4.4% |
| % Change to Pervious Quarter : | -15.3% | 24.6% | -14.0% | 10.2% | 7.6% | -7.3% | -9.4% | 9.6% | 3.6% | 15.0% | -18.7% | 18.9% |
To download HD image, right click on image and select “Save Image As”…